Abbott Sampling Platform
Pharma Sampling Analytics & Field-Force Reporting Platform
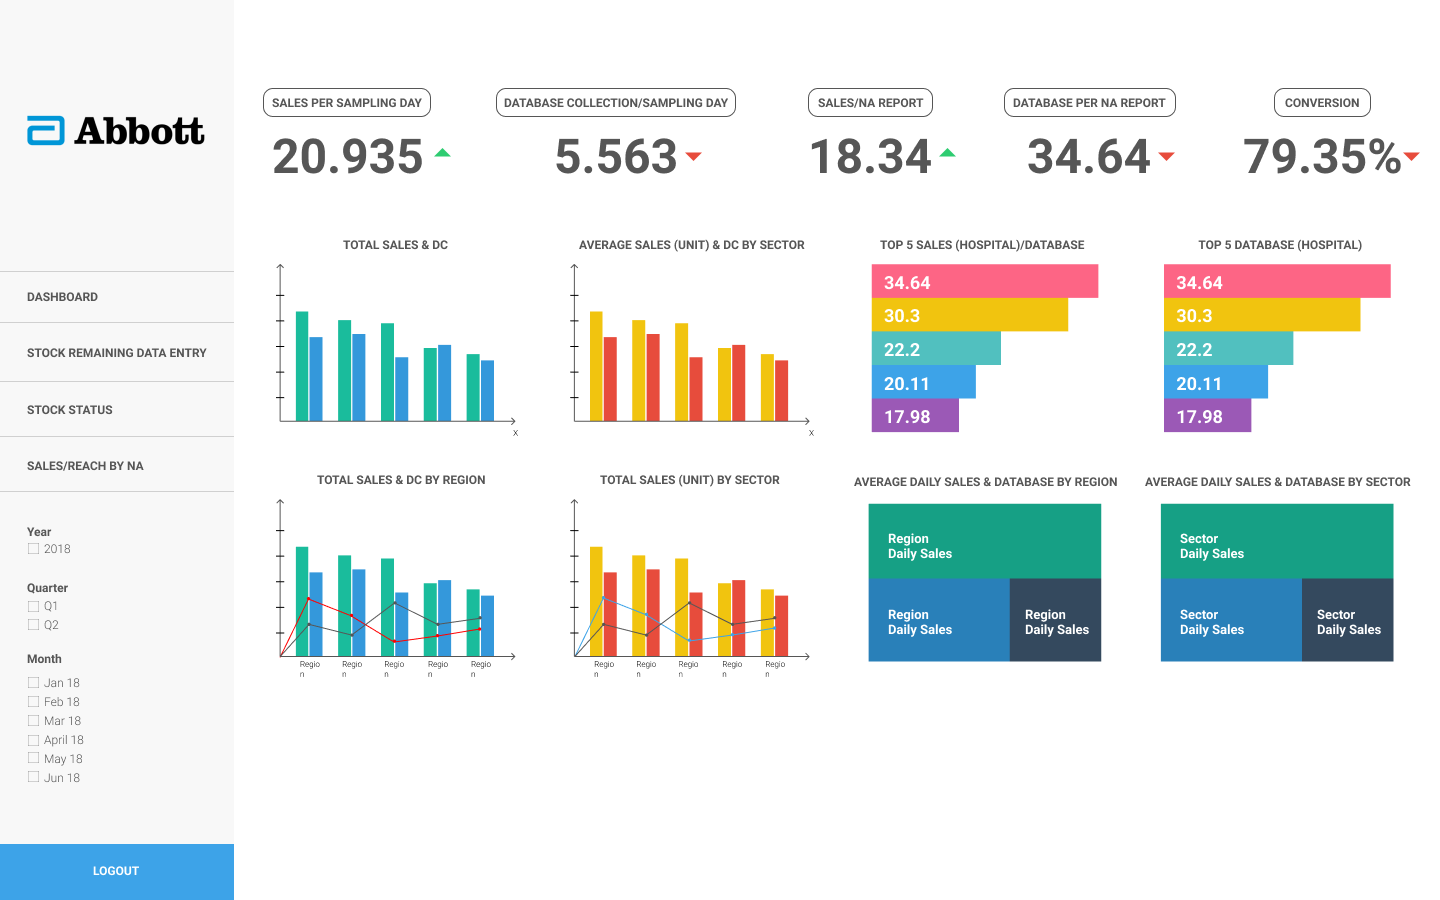
Pharmaceutical sampling and reporting platform for Abbott’s field force that captures every sampling day, attendance event, and stock movement, then surfaces sales-per-sampling, database-per-rep, and conversion insights through bar and line charts with year/quarter/month filters.
Overview
About this project
The Abbott Sampling Platform is a web-based analytics and operations system built by Advisory Apps in 2018 on CodeIgniter PHP for Abbott’s pharmaceutical field-force team. The platform turns daily sampling redemption, attendance, and stock-remaining entries into management-ready insights — sales per sampling day, database collected per sampling day, sales/database per nutritional advisor (NA), and overall conversion rate — visualised through bar and line charts that segment performance by sector, region, and top-5 hospitals. Heavily optimised database queries filter the underlying dataset down to the exact slice management asks for, with year, quarter, and month controls, and every report exports for offline review. A role-based admin layer governs data entry, stock-status review, and sales-reach reporting end-to-end.
What We Delivered
Key features & capabilities
Sampling Redemption Data Entry
Daily entry interface where field staff log each sampling activity, redemption, and stock movement, with audit-tracked timestamps and per-user attribution.
Field-Force Attendance
Captures and reports daily attendance per nutritional advisor so management can correlate presence in territory with sampling output and conversion.
KPI Dashboard with Bar & Line Charts
Top-line cards for sales per sampling day, database/sampling day, sales/NA, database/NA, and conversion, paired with bar and line charts spanning total sales, sector averages, and top-5 hospital performance.
Hospital, Sector & Region Segmentation
Aggregates every KPI across hospital, sector, and region cuts so management can compare performance vendor-by-vendor and territory-by-territory.
Year / Quarter / Month Filters
Time-period controls slice every chart and report by financial year, quarter, and month so trends can be inspected at any granularity in one click.
Optimised Reporting Queries
Heavily tuned database queries distil large sampling and redemption datasets into the precise slice management asks for, without slowing the dashboard.
CSV / Excel Data Export
Every report exports to CSV and Excel so finance and operations teams can pull the underlying rows for offline analysis and audit.
Stock Remaining & Stock Status
Daily stock-remaining entry per nutritional advisor, with a stock-status console that surfaces low-stock territories before they affect sampling activity.
Sales / Reach by NA Report
Drill-down view of each nutritional advisor’s sampling output, database growth, and conversion rate, used in monthly performance reviews.
Role-Based User Management
Separates field-rep, supervisor, and admin permissions so each role only sees the data and entry screens relevant to their job.
Want similar results for your business?
Let's discuss how we can build a custom solution tailored to your needs.
Get a Free Consultation